
Google Analytics is a free tool offered by Google that helps you get a deeper understanding of your customers so that you can analyse data for your business all in one place.
The following guide will show you how Google Analytics can provide valuable insights into who is visiting your dating site, how they got there and how they spend their time on your pages. Using this data will begin to shape your marketing strategy to become more profitable.
What can be achieved with Google Analytics?
- Find out how your visitors locate your website
- Identify which pages and links your visitors click the most
- Fine tune your website
- Track important metrics
- Monitor the effectiveness of your online marketing strategies, onsite content, user experience and device functionality
{{cta(’34c49851-5edc-4a3f-8c79-335e20d37295′,’justifycenter’)}}
III. Acquisition reports
IIII. Understand how your pages are performing and member behaviour
Before you begin
You’ll need to ensure you have an account set up on Google Analytics first.
Need help with setting up a Google Analytics account? Find out how to get started here or reach out to your partner manager today.
Alternatively, you can use our beginners guide to Google Search Console to see the correct set up to obtain your Google Site Tag.
It’s important to remember that you’re using the same Google account you wish to run any other Google Tools through such as Google Search Console and Google Ads.
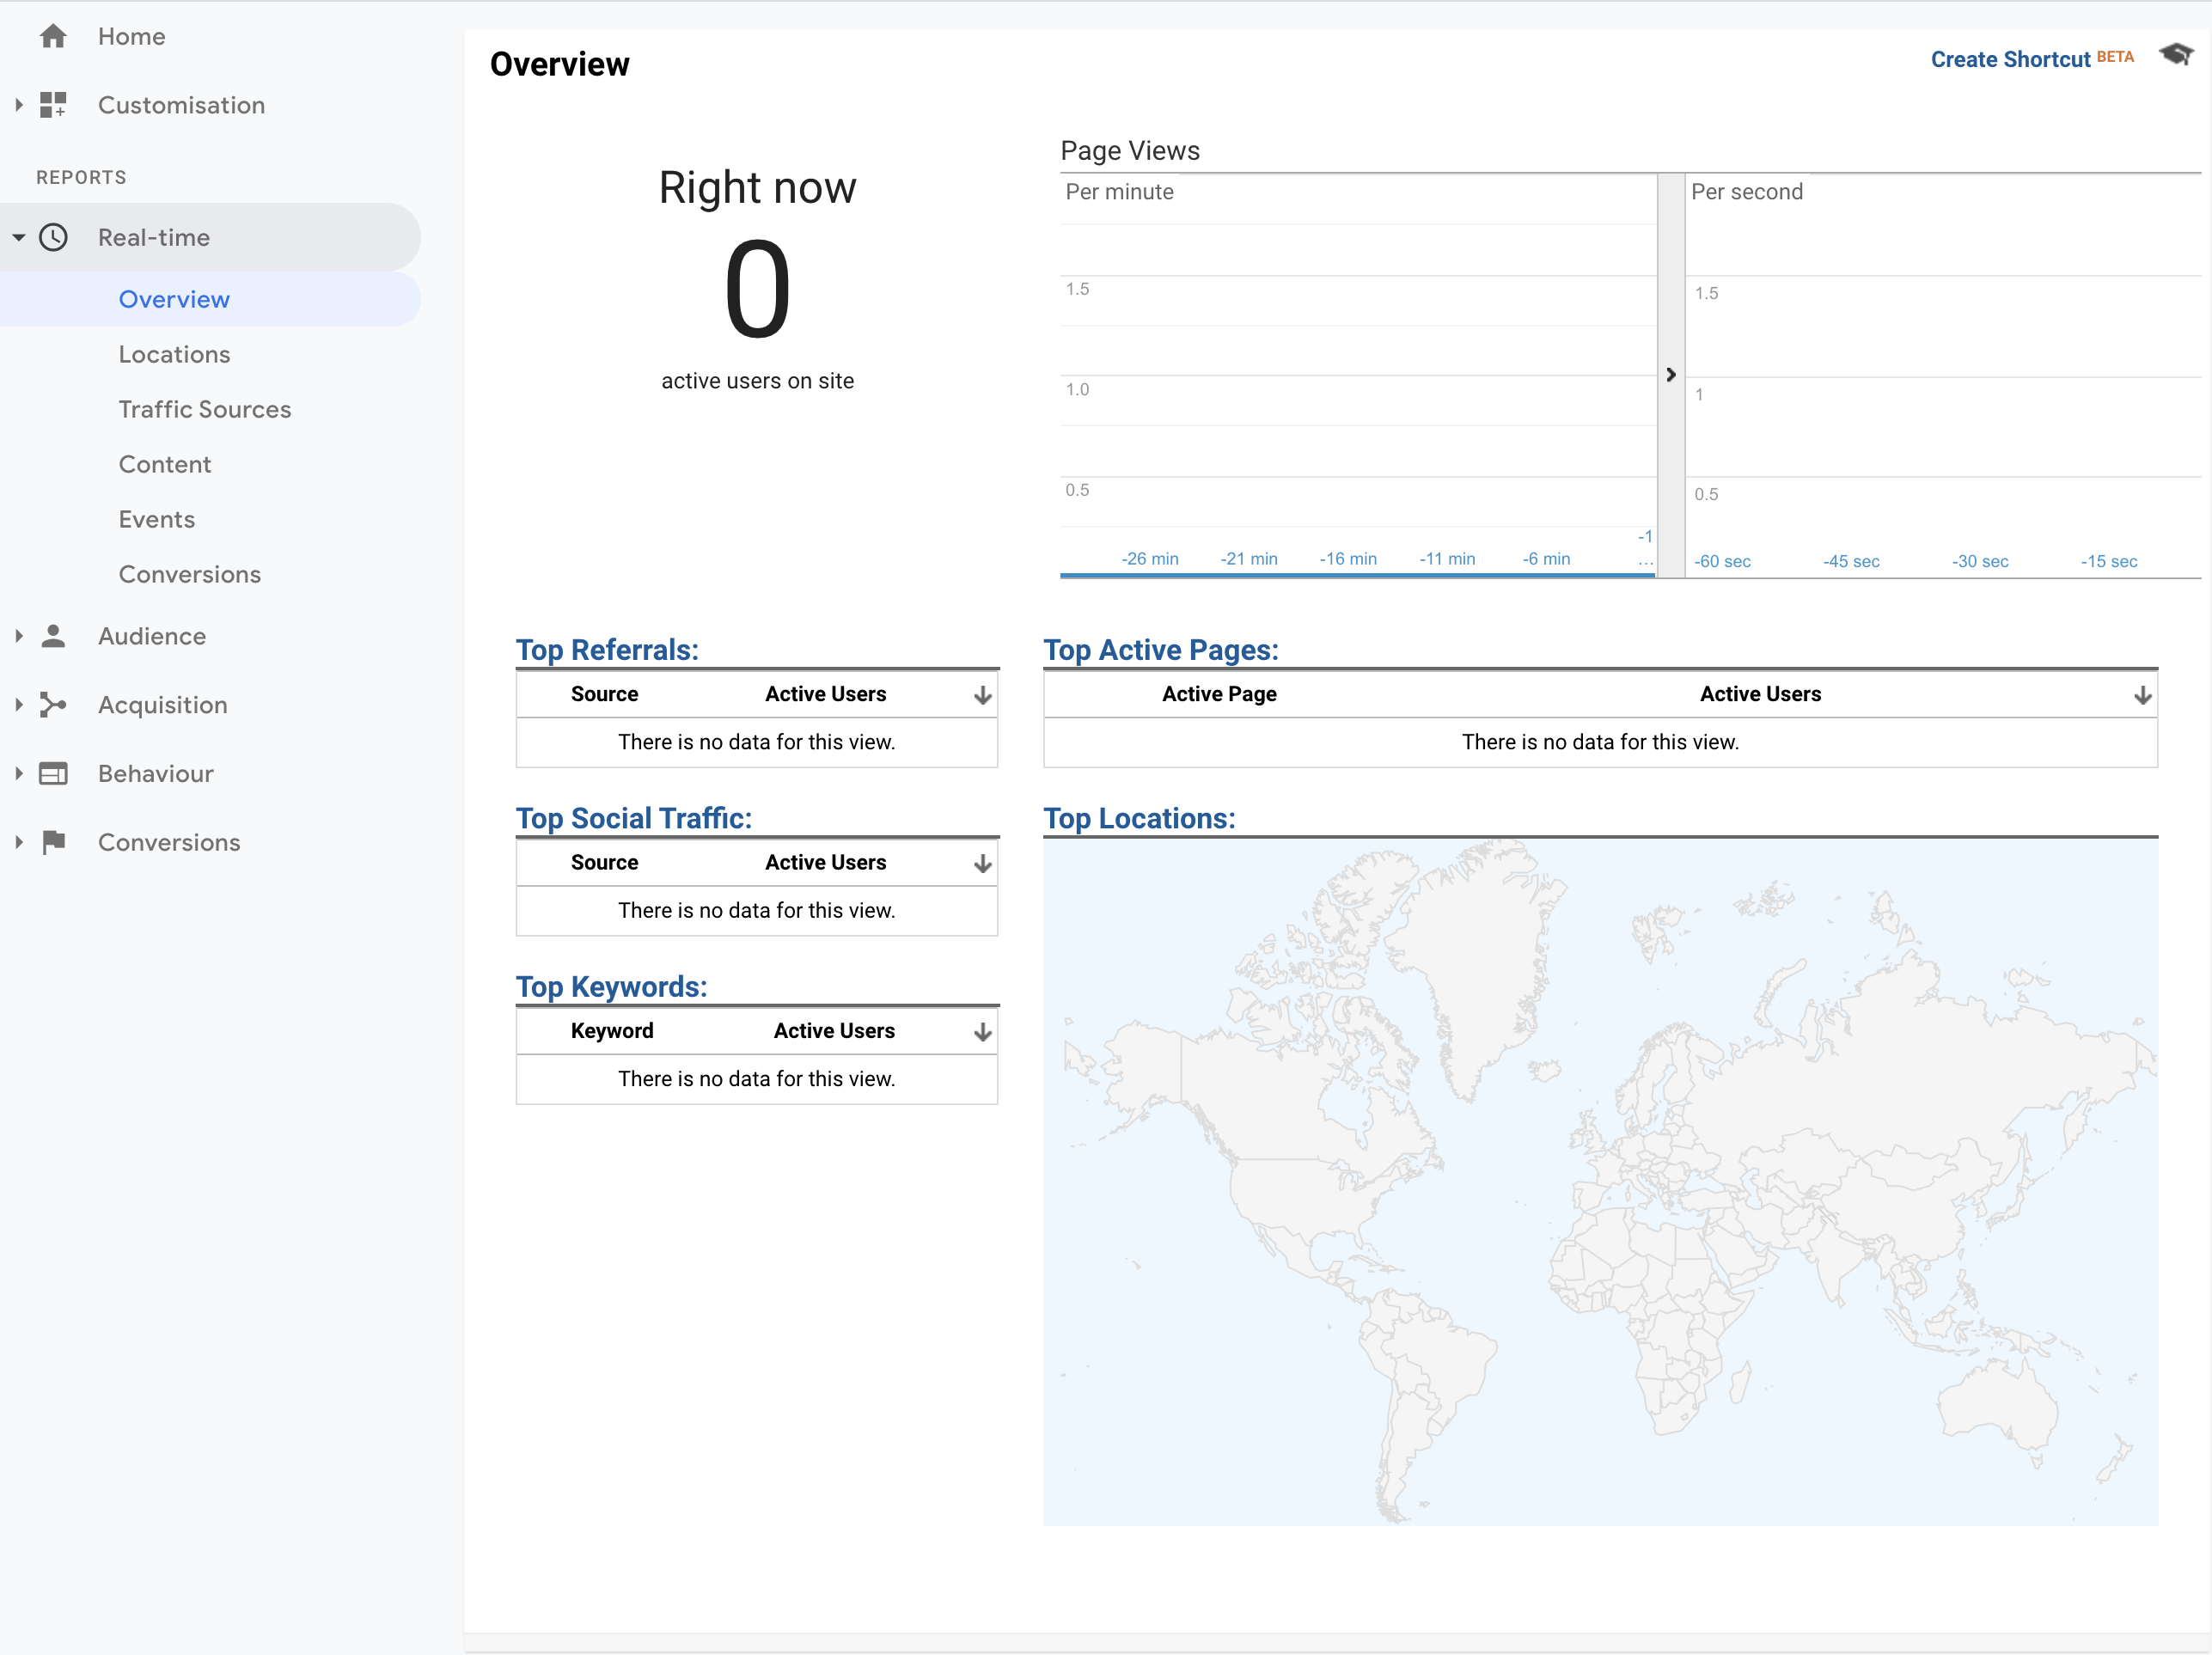
Step 1: Real-Time Overview
Real-Time allows you to monitor user activity as it happens on your site. This report displays data seconds after an interaction and is updated continuously, so you can see how many users you have right now and how they are engaging with your content.
You can see how many people are on your site right now, the location they are in, which content they are engaging with on site, what features they are interacting with most, and which goal conversions have occurred.
With Real-Time, you can immediately and continuously monitor the effects that new campaigns and site changes have on your traffic.
Step 2: Learn about your audience
Get to know your users – where they are, how often and how long they engage with your content, and what devices are most popular. The Audience reports give you a sense of the users that engage with your content.
Audiences in Google Analytics are users that are grouped together based on any combination of attributes that is meaningful to your business.
This report will show you a breakdown of your everyday users for all traffic sources.
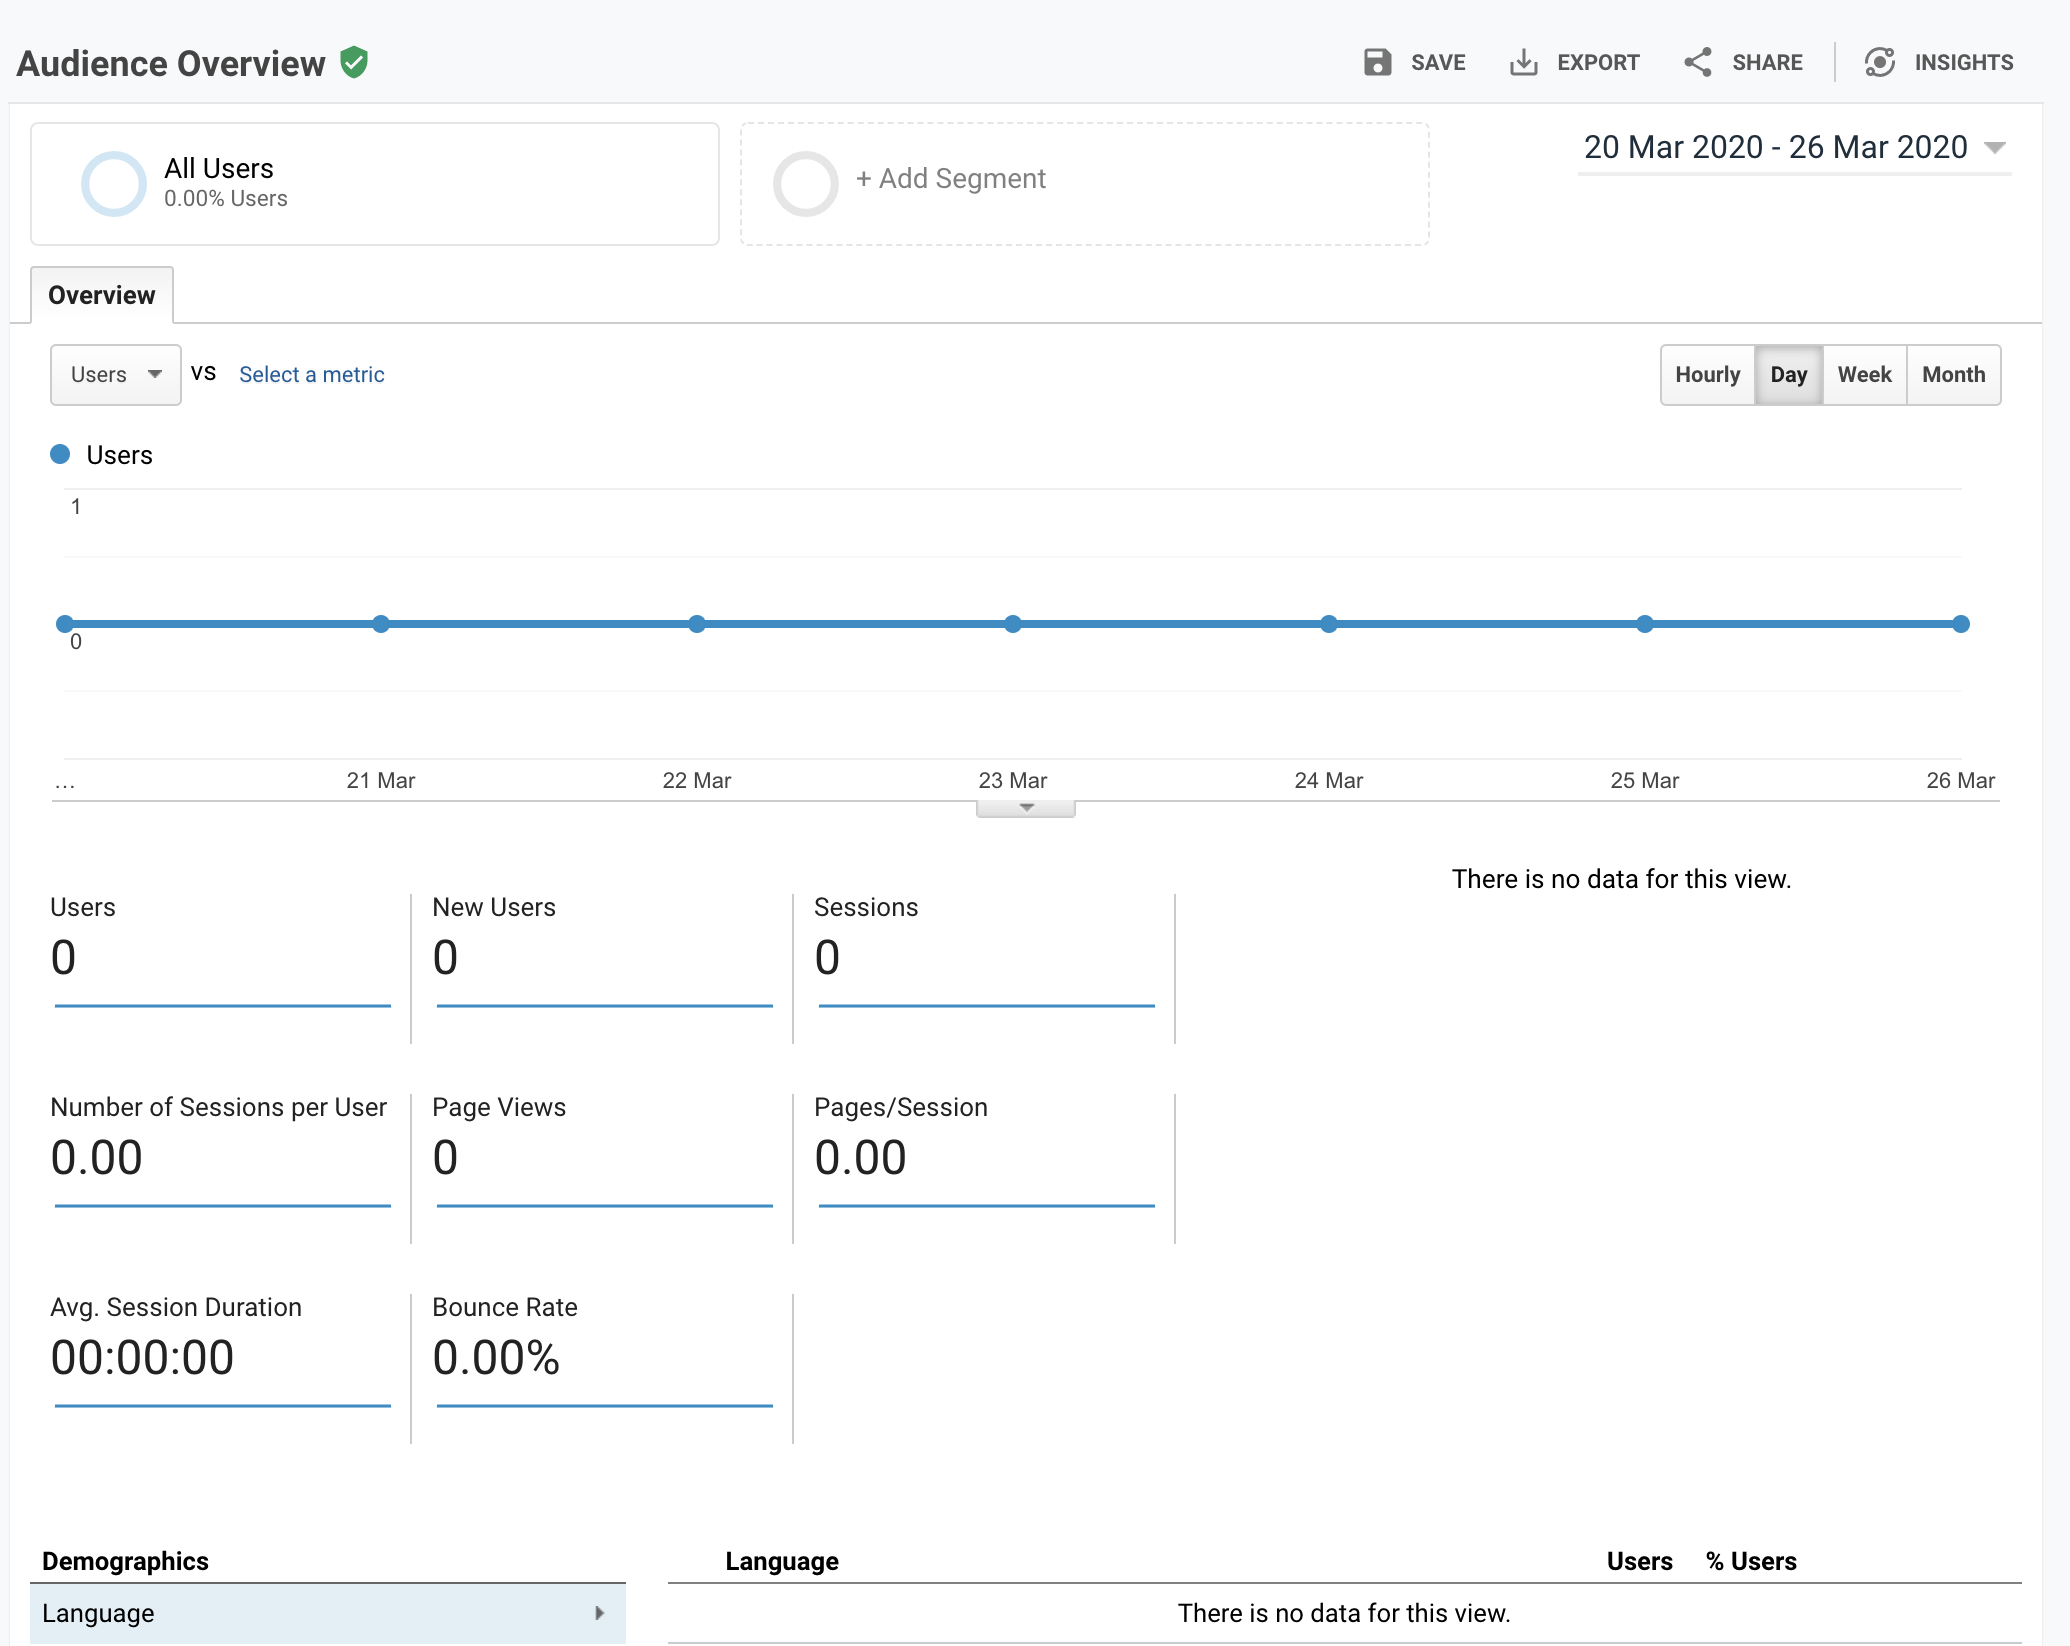
Get to grips with your users’ demographics; age and gender. This is extremely valuable when acquiring dating traffic.
Within GEO’s you can see the location of your members, new or returning and even what device or browser they’re using when visiting your site.
Knowledge of this allows you to optimise your campaigns based on your findings allowing for tailored ads which can reduce CPA’s and overall increase profit.
Step 3: Acquisition reports
Use the Acquisition reports to discover how users arrive at your web site. You can also use these reports to learn more about your traffic – if they arrive directly to your site or use a search engine – and how successful certain marketing campaigns are in attracting users.
This report breaks down your traffic by source: organic, direct, referral, email, social, paid search, display, affiliate, and (Other). (GA uses the (Other) category when it doesn’t know how to categorise a subset of traffic.
For all traffic, you can click into Channels. Click on any category to explore each source in detail.
Depending on the category, you’ll see landing pages (which URLs your visitors entered the site on), source (which website brought them to yours), or keyword (which query took them to your site.)
Step 4: Understand how your pages are performing and user behaviour
The more you know about how your site is performing, the better equipped you’ll be to make smart choices about your website.
Click Behaviour to see an overview of this.
If you have multiple landing pages for various paid campaigns you can see each page’s performance and optimise accordingly to reduce metrics like ‘bounce rate’.
Another important section here is ‘site speed’ in which you can see if there might be any issues with load time for your pages. Applying fixes to these areas will improve user experience and solidify your organic search listing, as well as decrease your target CPA’s (cost per acquisition).
Step 5: Conversions and Goals
Goals in Google Analytics help you keep track of the actions your website visitors did or didn’t take. A goal conversion takes place when your visitors complete a specific action you are tracking – for example, make a purchase.
There are four main types of goals:
- Destination
- Event
- Duration
- Pages/screens per session
You will need the assistance of your partner manager to set these up.
We’ve also implemented postback tracking. You can view the set up in our guide on How to set up Postback Tracking for Google.
Step 6: Additional features
With postback tracking now live you can benefit from using Custom Reports.
Create a custom report that shows you all your important metrics, including your event goals along with advertising metrics such as ‘cost’, ‘cost-per-click’ and ‘cost per conversion’. Combine analytics with a data studio, in which you can import multiple analytics accounts into one report for an ideal overview of your day to day spend and performance.
Reach out to your Partner Manager to discuss this further so reports can be tailored to your individual needs.
For assistance on further reports to tailor to your individual needs get in touch with your Partner Manager or reach out to [email protected] today!