
Types of Matching Algorithms
Rule-Based Filtering (Simplest)
Start here. It's not fancy, but it works.
Rule-based filtering shows profiles that match user's stated preferences:
- User's age preference (looking for age 25-35, show ages 25-35)
- Distance preference (willing to travel 5 miles, show within 5 miles)
- Location preference (only show city they specify)
- Interest overlap (both like hiking, both like travel)
- Gender preference (straight user looking for opposite gender)
- Relationship type (looking for casual, show casual users)
Technical implementation: Filter database query by these criteria. Check a few conditions before loading profile.
Pros:
- Fast (queries execute in milliseconds)
- Transparent (users understand why they see what they see)
- Controllable (easy to adjust rules)
Cons:
- Obvious (users quickly see all profiles matching their criteria)
- Doesn't learn (if user consistently ignores certain types of profiles, algorithm doesn't know)
- Doesn't surprise (limited serendipity, reduces engagement)
Collaborative Filtering
This algorithm learns from aggregate user behavior. It identifies patterns in who likes whom and uses those patterns to make recommendations.
Simple version: If User A likes many of the same profiles as User B, show User A the remaining profiles that User B liked.
Example:
- User A swiped right on: Sarah, Emma, Jessica
- User B swiped right on: Sarah, Emma, Jessica, Amanda, Nicole
- Recommendation: Show User A profiles of Amanda and Nicole (other users similar to User B also liked them)
Technical implementation: Build a matrix of users and profiles. Each cell contains engagement data (swiped right, swiped left, matched, messaged). Use math (singular value decomposition, matrix factorization) to identify clusters of similar users.
Pros:
- Learns from user behavior
- Discovers patterns humans might miss
- Better recommendations over time (more data = better accuracy)
- Less dependent on stated preferences
Cons:
- Requires user data (new platforms have the "cold start problem" - no data, no recommendations)
- Computationally expensive (matrix math on millions of users)
- Can create filter bubbles (users only see profiles similar to what they already like)
- Difficult to understand why specific profiles are recommended
Compatibility Scoring
Beyond age and interests, how compatible are two people really?
Compatibility scoring uses multiple factors:
- Personality traits (Big Five traits: openness, conscientiousness, extroversion, agreeableness, neuroticism)
- Love languages (words of affirmation, quality time, physical touch, acts of service, receiving gifts)
- Values (religion, politics, family orientation, career importance)
- Lifestyle factors (exercise frequency, sleep schedule, alcohol consumption)
- Interests (hobbies, travel, food, activities)
- Relationship goals (marriage timeline, kids, location stability)
Technical implementation: Users answer questions or quiz that measure these traits. System scores compatibility on each dimension. Combined score determines match quality.
Example scoring:
- Personality match: 75% (both introverted, both organized)
- Values match: 60% (different religion, similar family orientation)
- Lifestyle match: 85% (both active, both prefer early mornings)
- Interest match: 70% (overlap on travel and food, differ on sports)
- Overall compatibility: 72%
Pros:
- More meaningful matches (two people with high compatibility have better first dates)
- Reduces time-wasters (users aren't matched with fundamentally incompatible people)
- Increases long-term satisfaction (couples matched on core values stay together longer)
- Users feel matched on "deeper level"
Cons:
- Requires users to complete lengthy quiz (friction in onboarding, some users skip)
- Personality tests are pseudoscience (Big Five traits are scientifically validated, but their role in dating success is debated)
- Time to first match (users need to complete quiz before matches are generated)
Popular compatibility models:
- Big Five Personality Traits (validated by decades of psychological research)
- Myers-Briggs (popular but less scientifically rigorous)
- Love Languages (popular but not scientifically validated)
- Enneagram (popular but not scientifically validated)
Collaborative Filtering Explained
This is the closest thing to how Tinder, Bumble, and Hinge work at scale.
Basic Collaborative Filtering Process
Step 1: Build user-profile engagement matrix
- Rows: users
- Columns: profiles
- Cells: engagement (1 for like, -1 for pass, blank for unseen)
This matrix is massive (millions of users, millions of profiles = trillions of cells, mostly empty).
Step 2: Find similar users
- User A's likes: Sarah, Emma, Jessica, Amanda
- User B's likes: Sarah, Emma, Jessica, Nicole
- Similarity score: 3 out of 4 matches = 75% similar
Step 3: Recommend profiles
- Find other users similar to User A
- Look at profiles those similar users liked
- Recommend profiles with highest overlap
Step 4: Rank recommendations
- Show most-liked profiles first
- Balance popularity with personalization (don't just show profiles liked by thousands)
Cold Start Problem
New platforms and new users have the cold start problem. There's no historical data to generate recommendations from.
Solutions:
- Use demographic similarity (if no behavior data, match on age, location, interests)
- Ask onboarding questions (infer preferences from initial questions)
- Seed with popular profiles (show new users profiles that attracted many swipes)
- Use hybrid approach (combine demographic + early behavior signals)
Most platforms solve cold start with a demographic baseline (age, location, interests) until 30-50 user interactions are recorded. After that, behavior-based recommendations kick in.
Filter Bubbles
Collaborative filtering can create filter bubbles. If a user consistently likes profiles of a certain type, the algorithm will keep showing similar profiles. User never discovers profiles outside their bubble.
Solutions:
- Randomize 20-30% of recommendations (introduce serendipity)
- Explicitly ask for preference changes ("Want to explore different types?")
- Use exploration vs. exploitation tradeoff (90% personalized recommendations, 10% random exploration)
- Monitor for bubble effects and adjust algorithm
Compatibility Scoring
Calculating Compatibility
Assume a user answers questions across four dimensions:
- Personality (20 questions): Big Five traits
- Values (15 questions): religion, politics, family
- Lifestyle (10 questions): exercise, sleep, substances
- Interests (15 questions): hobbies, travel, food
System calculates scores for each dimension. Then calculates overall compatibility.
Example calculation:
User A Big Five scores: Openness 60%, Conscientiousness 75%, Extroversion 55%, Agreeableness 80%, Neuroticism 45%
User B Big Five scores: Openness 65%, Conscientiousness 70%, Extroversion 50%, Agreeableness 85%, Neuroticism 40%
Compatibility on each trait (correlation between A and B):
- Openness: 96% compatible (both moderate-high)
- Conscientiousness: 98% compatible (both high)
- Extroversion: 98% compatible (both moderate)
- Agreeableness: 98% compatible (both high)
- Neuroticism: 98% compatible (both low)
Average personality compatibility: 97.6%
Repeat process for values, lifestyle, interests. Weight dimensions by importance (maybe personality is worth 30%, values 30%, lifestyle 20%, interests 20%).
Final compatibility score: Weighted average of all dimensions.
Weighting Different Factors
Different platforms weight factors differently based on their mission:
Faith-based platform (eHarmony-style):
- Values: 40% (religion alignment is crucial)
- Personality: 30%
- Lifestyle: 20%
- Interests: 10%
Casual dating platform (Tinder-style):
- Personality: 20%
- Values: 5% (less important for casual)
- Lifestyle: 20%
- Interests: 20%
- Attraction signals: 35% (how quickly they swiped right)
Fitness dating platform:
- Lifestyle: 40% (exercise frequency, fitness goals)
- Interests: 30% (shared athletic interests)
- Personality: 20%
- Values: 10%
Weights should match your platform's values and member priorities.
Machine Learning Matching
This is where sophisticated dating platforms live in 2026.
Understanding Machine Learning Matching
Machine learning algorithms learn from patterns in user data without being explicitly programmed.
Training process:
- Collect user interaction data (who swiped right, who matched, who messaged, who met, who stayed in contact)
- Label outcomes (successful matches are couples that messaged for 10+ exchanges, unsuccessful are couples that didn't)
- Train model to predict success (what profile attributes predict successful matches)
- Deploy model (use model to rank profiles for each user)
- Monitor performance (does model's recommendations actually increase matches?)
- Retrain regularly (new data improves model)
Signals Machine Learning Uses
Features the model considers:
- User profile attributes (age, height, education, interests)
- Previous swipe history (what types of profiles has this user liked?)
- Message patterns (did they send long thoughtful messages or short lazy openers?)
- Engagement history (how many messages before they disappeared?)
- Response time (how quickly do they respond to matches?)
- Meeting success (did matches result in real dates?)
The model learns: "Users with engineering degrees and hiking interests have 2x higher match quality with people who like travel and outdoor activities." It doesn't know why, it just learns the pattern from historical data.
Building a Machine Learning Model
Simplified process:
Step 1: Collect data (6-12 months of user interactions) Step 2: Define "successful match" (lasted 20+ messages, led to real date, resulted in relationship) Step 3: Extract features (350+ attributes per user) Step 4: Train model (use gradient boosting or neural networks) Step 5: Evaluate accuracy (does model predict successful matches better than random?) Step 6: Deploy in production (use model to rank recommendations) Step 7: Monitor (track if model improves engagement)
Why You Need Months of Data
Machine learning requires substantial historical data. A fresh model trained on 1,000 users will perform poorly. After 100,000 users and 50,000 interactions, the model becomes useful.
This is why young dating platforms don't have sophisticated ML matching. They don't have enough data. This is also a competitive advantage for established platforms (Tinder, Bumble) - they have billions of interactions worth of training data.
Timeline: Expect 6-12 months before ML model outperforms rule-based matching.
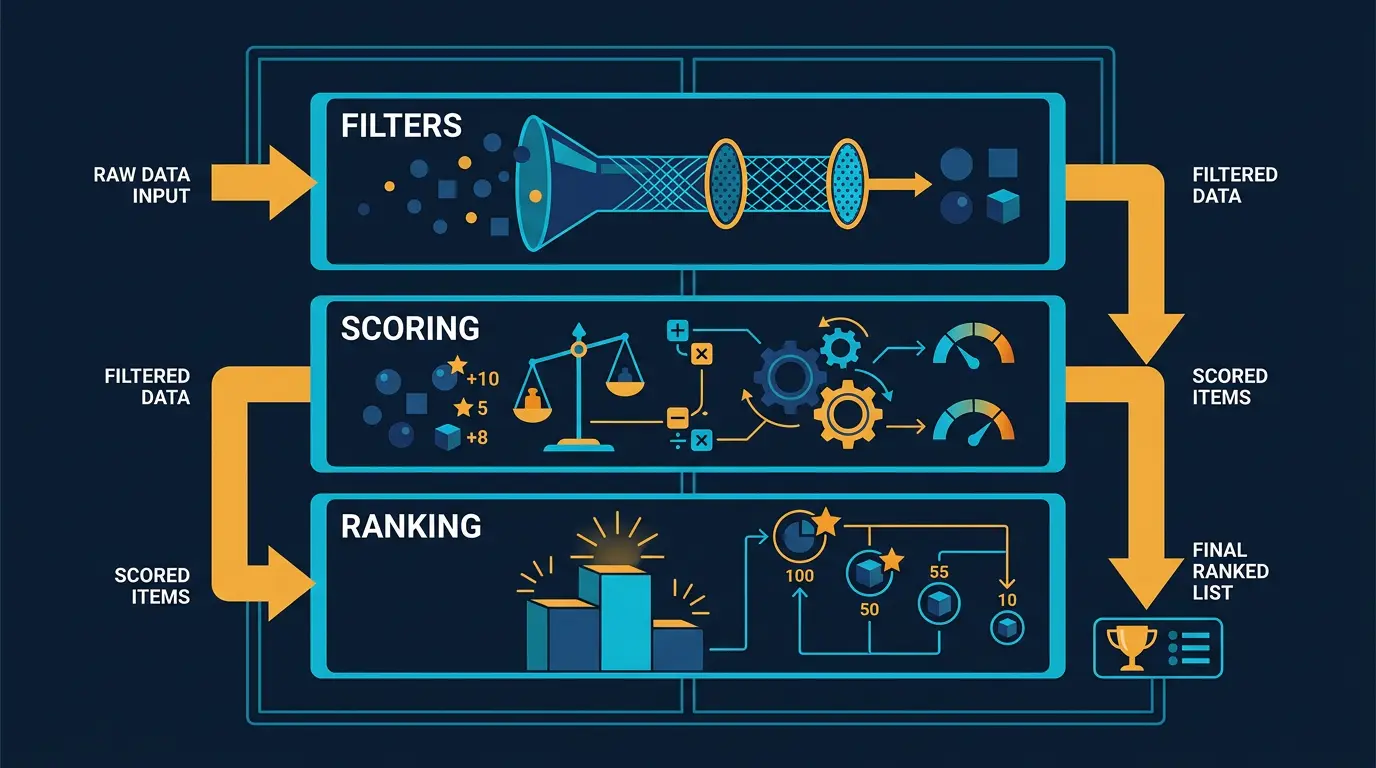
Ranking and Sorting Profiles
Once you've identified candidate profiles to show a user, you need to rank them.
Relevance Ranking
Sort profiles by predicted relevance (estimated probability user will like the profile).
Signals:
- Compatibility score (if using compatibility matching)
- Collaborative filtering score (similar to profiles this user has liked)
- Recency (show newer profiles before older profiles)
- Engagement (show profiles with recent photos/bios before dormant profiles)
- Popularity (show profiles that attract many likes)
Tinder's algorithm reportedly weighs:
- Compatibility (40%)
- Recency (20%)
- Distance/proximity (20%)
- Activity/engagement (15%)
- Popularity (5%)
This is estimated - Tinder doesn't publish exact weights.
Balancing Accuracy and Diversity
If you only show the "best matches," users get bored quickly. All profiles look the same.
Solution: Show 70% highest-relevance matches, 20% interesting but less relevant matches, 10% complete surprises.
This keeps recommendations fresh while maintaining quality.
Time-Aware Ranking
Users are more likely to match with profiles they see at the right time.
Tinder reportedly considers:
- Time of day (show active profiles when user is active)
- Day of week (show profiles differently on weekday vs. weekend)
- Seasonality (dating behavior changes by season)
If user is most active at 10 PM, show them profiles that are usually active at 10 PM (higher likelihood of both being online for messaging).
Location and Proximity Matching
Geography matters enormously in dating.
Distance Calculation
Store user coordinates (latitude, longitude). Calculate distance between two users using haversine formula.
Distance = 3,959 * acos(sin(lat1) * sin(lat2) + cos(lat1) * cos(lat2) * cos(long1 - long2))
This gives approximate distance in miles. Users within 10-25 miles are typically shown first.
Geospatial Indexing
Searching all users by distance is computationally expensive (millions of distance calculations).
Solution: Use geospatial database indexing (geo-hashing, quadtree).
Divide geographic area into grid cells. Index users by cell. When looking for nearby users, only query relevant cells.
This reduces computation from O(n) to O(log n) - massive improvement at scale.
Dynamic Location Updates
Most platforms refresh user location when app opens (not continuously).
Continuous location tracking kills battery. Periodic updates (when app opens, every 5-30 minutes) work well.
Privacy consideration: Real-time location tracking creates safety risks. More granular location data = higher risk of stalking/harassment.
Behavioral Signal Integration
Beyond what users say, how they act reveals their true preferences.
!Matching algorithm architecture from rule-based to machine learning *Matching algorithm architecture from rule-based to machine learning*
Swipe Patterns
- How quickly do they swipe? (Quick = less selective, slow = very selective)
- What age range do they gravitate toward? (Often different from stated preference)
- What body types do they like? (Stated preferences often differ from actual swipes)
- How selective are they overall? (Some users swipe right on 50%, others on 2%)
Swiping behavior is incredibly predictive of match quality. If a user consistently swipes right on athletic body types, show them athletic profiles even if they didn't specify that preference.
Messaging Patterns
- Do they send first messages or wait?
- What do they say in opening messages? (Thoughtful openers vs. "Hey")
- How long are their messages?
- How quickly do they respond?
- How long do conversations last before dying?
Users who send thoughtful opening messages are 2-3x more likely to convert matches into dates.
Engagement Patterns
- How often do they log in?
- How long are their sessions?
- What time of day are they active?
- Do they hide/show their profile at certain times?
- Do they update their profile frequently?
High-engagement users are more likely to meet someone. Match high-engagement users with each other.
Predicted Churn
Machine learning can predict which users are likely to leave the platform.
Signals:
- Decreasing login frequency
- No matches in last week despite swiping
- Matches not responding
- Negative interactions (blocked by multiple users)
Solution: Reach out to at-risk users with engagement tactics (suggest similar interests, highlight new features).
Algorithm Performance Metrics
How do you know if your matching algorithm is working?
Match Quality Metrics
- First message response rate (% of matches that exchange 1+ message)
- Conversation length (average messages in first conversation)
- Second conversation rate (% of matches that have 2+ conversations)
- Meeting conversion (% of matches that lead to real-world date)
- Long-term success (% of matches that result in relationship lasting 3+ months)
Track these by algorithm version. Algorithm A has 45% first message response rate. Algorithm B (new version) should have higher rate.
Engagement Metrics
- Average swipes per user per day
- Session duration
- Daily active users
- Monthly active users
- Retention (% of new users active in week 2)
Good matching algorithm increases engagement (users spend more time swiping when recommendations improve).
Fairness Metrics
- Match rate by demographic group (do men and women have equal match opportunities?)
- Visibility inequality (are some profiles shown much more than others?)
- Geographic fairness (do rural users have equal match opportunities as urban?)
Algorithms can accidentally discriminate. If your ML model learns from historical data that straight men prefer certain body types, it might over-recommend those body types, making other users invisible.
Monitor for these biases and explicitly adjust algorithm to improve fairness.
Common Pitfalls and Solutions
Pitfall 1: Optimizing for Wrong Metric
Most platforms optimize for matches (increases short-term engagement) but should optimize for meaningful conversations (increases long-term retention and real-world dates).
Solution: Use multiple metrics. Track both matches and message quality. Don't just maximize volume.
Pitfall 2: Showing Everyone the Same Profile
Popular profiles get recommended to almost everyone. They become overloaded with matches, lose time, and churn.
Meanwhile, unpopular profiles never get shown. They get zero matches, become discouraged, and churn.
Solution: Randomize recommendations (don't always show profiles by popularity). Give less popular profiles exposure.
Pitfall 3: Cold Start Destroying Early Growth
New users see random profiles (no data to recommend from). They get poor matches. They churn before data accumulates.
Solution: Use demographic matching during cold start period. Ask onboarding questions to infer preferences.
Pitfall 4: Filter Bubble Reducing Diversity
Users see same type of profile over and over. They get bored. Engagement decreases.
Solution: Explicitly introduce diversity. Show 80% personalized matches, 20% random exploration.
Pitfall 5: Slow Algorithm Recommendations
Generating personalized recommendations for millions of users in real-time is computationally expensive.
If you take 5 seconds to load next profile, users leave.
Solution: Pre-compute recommendations. Batch nightly jobs to generate recommendations. Cache results. Serve cached recommendations in real-time (refresh every 4-24 hours).
Pitfall 6: Not Monitoring Algorithm Drift
Over time, user behavior changes. Algorithm trained 1 year ago becomes stale.
Solution: Retrain models monthly. Monitor metrics to detect performance degradation. A/B test new algorithm versions.
*Caption: Evolution of matching algorithms showing progression from rule-based filtering through collaborative filtering to advanced machine learning systems.*
Key Takeaways
- Start with rule-based filtering (age, location, interests). It's simple, fast, and transparent. Upgrade to ML after 6 months of data.
- Collaborative filtering learns from user behavior patterns. It's powerful but requires data and computational resources.
- Compatibility scoring increases match quality but requires users to complete personality quiz (friction). Only use if your platform emphasizes meaningful matches.
- Machine learning models need 6-12 months of substantial user data before outperforming simple algorithms.
- Location and proximity are critical factors. Users mostly match with people nearby.
- Behavioral signals (swiping patterns, messaging style, engagement) are more predictive than stated preferences.
- Balance personalization with diversity. Show 80% personalized recommendations, 20% surprises.
- Monitor algorithm fairness. Don't accidentally create disparities in match opportunities across demographics.
- Optimize for meaningful conversations and real meetings, not just match volume.
- Retrain models monthly to prevent algorithm drift as user behavior changes.
- Pre-compute recommendations nightly and serve cached results. Don't compute recommendations in real-time.
Choosing a Platform with Smart Matching
Select platforms with proven matching algorithms. Understand how messaging features complement matching. And consider AI features that enhance matching over time.
See our guide on Essential Dating Site Features for how matching integrates with overall product strategy.
DatingPartners ships with hybrid ranking and proven filters out of the box. See matching quality live.
Visit DatingPartners.com →